Technical whitepaper
LogScope AI v2.0
SRE log aggregation, deterministic anomaly detection & AI incident triage — problem, architecture, tooling, dashboard guide, current deployment stack and hardening path. Last updated 2026-09-06. Live system: logscope.freengineer.me.
1. The problem we solve
Modern services emit thousands of log lines per second across multiple files, hosts and formats. Engineers face four pains:
- Volume without signal — repetitive lines bury the one new error that matters.
- Slow correlation — connecting a spike in service A to a timeout in service B is manual grep work.
- Alert fatigue — threshold alerts fire on noise; real incidents hide inside them.
- Unsafe AI shortcuts — pasting raw logs into an LLM leaks passwords, tokens, emails and customer IDs.
LogScope treats logs as an application heartbeat: compress repetition into templates, watch the pulse for arrhythmia with deterministic rules, and call the LLM only as a triage copilot over sanitized, bounded evidence.
2. Design principles
- Sanitize first, stream second. Raw lines never cross the Kafka boundary and never enter an AI prompt. Redaction + client-ID hashing happen in the collector.
- Deterministic detection before AI. New-template, frequency-spike (z-score ≥ 3.0) and error-burst rules fire on math; the model only judges whether it deserves investigation.
- Bounded everything. Max 5 redacted samples per template per 5-minute bucket; bounded queues that drop oldest-first with visible counters instead of blocking.
- Honest UI. Dropped events, consumer lag, AI failures and data-loss warnings are first-class dashboard citizens — the system never claims complete analysis when data was dropped.
3. Architecture
Retention
| Data | Kept | Where |
|---|---|---|
| Kafka events (sanitized) | 24 hours | KRaft topics |
| Raw & redacted samples | 24 hours, auto-deleted | SQLite |
| 5-minute aggregates, anomalies, AI analyses, embeddings | 6 months | SQLite WAL + vector index |
4. Tools we use
| Layer | Tool | Why |
|---|---|---|
| API + dashboard | FastAPI, SSE, Tailwind, Chart.js | Real-time triage UI with zero build step |
| Template mining | Drain3 (per app+env) | Online clustering of repetitive lines |
| Streaming | Apache Kafka KRaft | Buffering, replay, consumer isolation; PRD-mandated boundary |
| Storage | SQLite WAL + numpy vector index | Single-file ops, concurrent readers, similarity search |
| AI triage | NVIDIA NIM / OpenAI / Gemini (fallback chain) + heuristic offline mode | Structured Sev-0..Sev-4 verdicts, prompt-injection guarded |
| Edge + deploy | Caddy, Docker Compose, Terraform, GitHub Actions | HTTPS, reproducible stack, IaC, CI/CD |
| Secrets | OCI Vault + instance principals | Keys never live in git, images or CI |
| Ingestion options | Fluent Bit, Kafka raw topic, CloudWatch Lambda | Node agents, direct streams, serverless forwarders |
5. Dashboard guide — every box on screen
Navbar: Live Stream + v2.0
Pulsing Live Stream pill reflects SSE connectivity (green = connected). The v2.0 badge marks the release; this whitepaper link sits beside it. The WAL SQLite • Sanitized Kafka note states the storage/streaming posture.
Warning banner
Appears only when something needs attention: backpressure drops, Kafka lag, or AI provider errors with retry state. Hidden when healthy — its absence is itself a signal.
KPI cards
- Ingestion Rate — lines/sec across all tailers, plus lifetime total. Validates the ~1,000 LPS target.
- Buffer Lag & Drops — queued observations and cumulative dropped count. Any non-zero drops mean triage is approximate.
- Active Anomalies — triaged incidents in the current window.
- Drain3 Clusters — unique templates mined; click to open the template browser, with active source count below.
5-Minute Ingestion Volume & Anomaly Timeline
Chart.js chart of bucketed observation volume (cyan) overlaid with error spikes (rose), fed by /api/buckets/timeline. Refresh icon reloads on demand; it answers “did anything just change?” at a glance.
Active Anomalies + filters
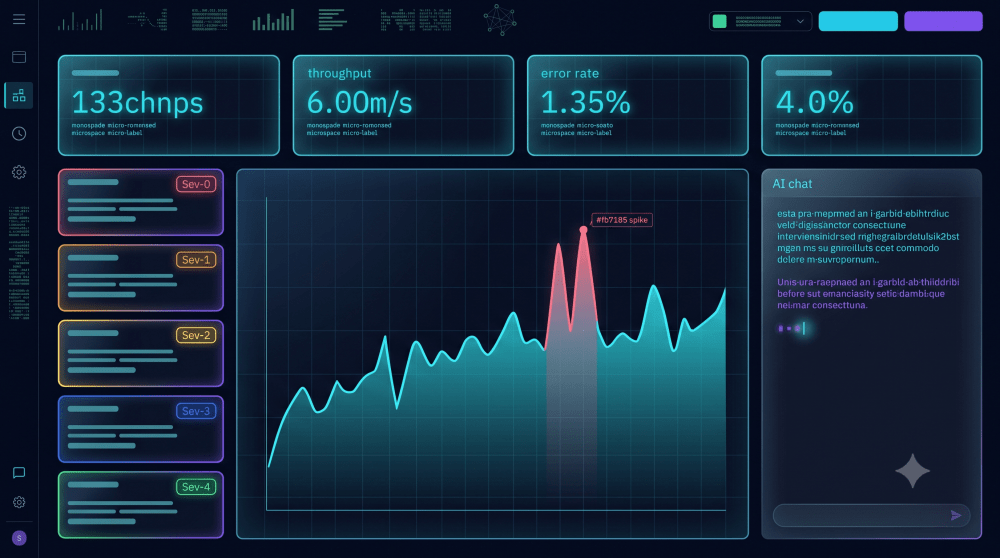
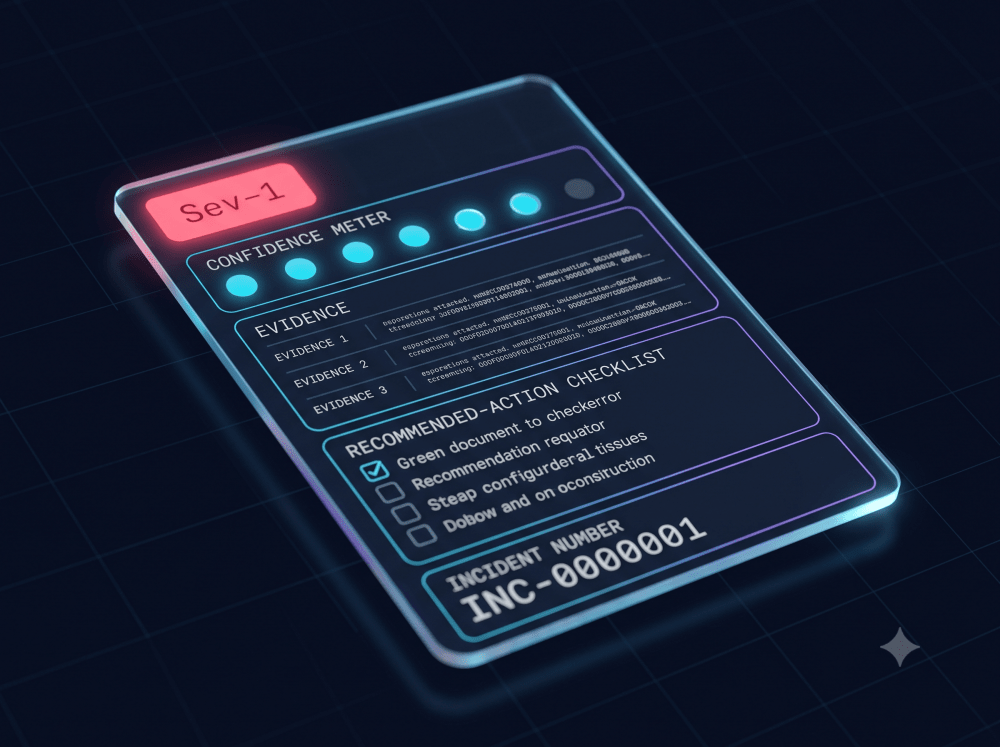
Each card carries an INC + 7-digit incident number, severity (Sev-0 critical … Sev-4 info), confidence (very-low…very-high), AI summary, evidence (template IDs, counts, source path/line), possible causes and recommended actions. The auto-refresh dropdown (5s/10s/30s/60s/Off) plus manual Refresh control polling; severity/application/environment/source filters narrow the feed. Empty state (“All Services Operating Normally”) confirms detectors ran and found nothing — distinct from a disconnected stream.
Dismissed Anomalies Archive
Collapsible history with outcome badges: green Resolved, amber False Alarm, slate Transient. Nothing is deleted — every verdict stays queryable for future AI context.
Ask SRE Copilot
Textarea that morphs into a persistent chat thread on first answer, with follow-up input. Queries embed against historical templates/incidents and answer with evidence references — or explicitly state when evidence is insufficient.
Monitored Sources
Each configured source with application, environment, path and heartbeat status. Read-Only guarantees the collector never writes to log directories.
Incident Action & Resolution modal
Three outcomes: Resolved (fix notes indexed into vector memory for future triage), False Alarm (expected/harmless, kept out of resolution memory), Transient (blip, quick dismiss).
Mined Templates + drill-down modal
Template browser; per-template drill-down shows the pattern, founding sample message, 5-minute bucket rollup history table and bounded sanitized evidence samples — the full audit trail from pulse to verdict.
6. Current deployment stack
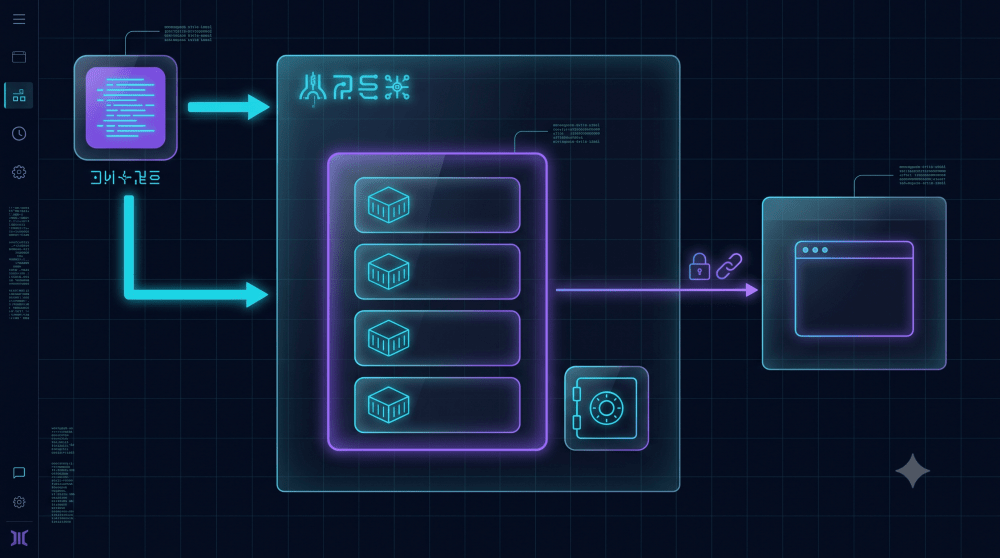
LogScope runs today as a single Oracle Always Free Ampere A1 VM (2 OCPU / 12 GB, Terraform-managed, reserved public IP) hosting Kafka, the app, the demo workload generator and Caddy edge proxy for https://logscope.freengineer.me. LLM secrets live in OCI Vault and are refreshed on the VM via instance principal — they never appear in git, images or CI. Two GitHub Actions workflows operate it: infra.yml (infrastructure apply/destroy) and cd.yml (pull, native-ARM rebuild, health-gated at /api/health). Total cost: $0/month inside Always Free limits (200 GB disk, 10 TB egress).
| Piece | What runs | Notes |
|---|---|---|
| Compute | 1× VM.Standard.A1.Flex, Ubuntu 24.04 ARM | Terraform state in OCI Object Storage; live VM imported, replacement-guarded |
| Network | VCN + public subnet, 80/443 open, SSH key-only | Reserved public IP survives restarts — no DNS churn |
| Stack | Kafka KRaft + LogScope + demo-app + Caddy | deploy/oracle/docker-compose.production.yml |
| Secrets | Vault: OpenAI / Gemini / NVIDIA keys | OCIDs on VM only; values pulled at deploy time |
| Pipeline | CI pytest+compose, CD over SSH | production environment-gated |
7. Production hardening (open questions)
Beyond the current stack, these take it production-grade. Defaults proposed; final calls pending review:
| Topic | Direction | Status |
|---|---|---|
| Authentication | SSO (GitHub/Google) in front of dashboard; single-user mode ends | Open — provider choice pending |
| Availability | Second VM / managed Kafka; SQLite → Postgres when write contention bites | Open — trigger thresholds pending |
| Alerting | Sev-0/Sev-1 → Slack + PagerDuty webhooks from AI worker | Open — channels pending |
| Backups | OCI volume backups + SQLite dumps to Object Storage bucket | Planned |
| Real log sources | Fluent Bit DaemonSet / Kafka raw topic / CloudWatch forwarder (all built); steady feed choice pending | Open — source decision pending |
| Privacy hardening | HMAC (keyed) client pseudonymization replacing POC SHA-256 | Planned |
| Cost control | Stay in Always Free envelope; egress + retention monitors before any paid step | Guardrail |
Open production questions for review: SSO provider? Alert channels? Second-VM trigger? Which steady log source? Answers get recorded in docs/DECISIONS.md.
8. Verification snapshot
34/34 tests passing; ~1,000+ lines/sec sustained with zero drops (benchmark); /api/health 200 in production. Acceptance criteria trace to PRD.md §20.
9. Image generation prompts (theme-locked)
Figures 1–3 above are hand-built inline SVG so they always render. For cover art or slides, use these prompts. Append this style block to every prompt so output matches the LogScope theme:
Style: dark SRE-console aesthetic, deep navy background #070b1a, glowing cyan #22d3ee + electric violet #8b5cf6 accents, rose #fb7185 reserved for errors, emerald #34d399 for healthy states, glassmorphism panels, subtle grid, monospace micro-labels allowed but NO readable sentences, NO logos, NO watermarks.
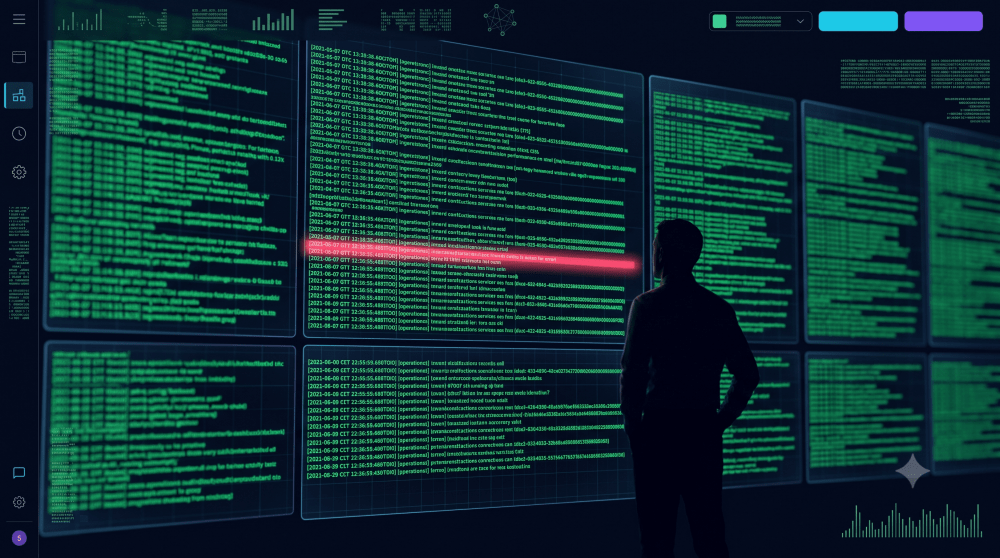
- P1 — problem cover (16:9): “Operations-center wall of monitors drowning in scrolling green log text, a single glowing rose-red error line pulsing among them, lone engineer silhouette in foreground. Cinematic wide shot, shallow depth of field.” + style block.
- P2 — dashboard hero (16:9): “Dark-mode SRE dashboard UI: four glass KPI cards on top, large cyan area chart with one rose spike annotation, incident cards with Sev-0…Sev-4 badges left, AI chat panel right. Clean layout, generous spacing, glowing accents.” + style block.
- P3 — pipeline diagram (3:1 wide): “Horizontal data pipeline of seven rounded glass nodes connected by glowing cyan lines: log files → shield → clustered templates → streaming hub → bar-chart buckets → robot analyst → dashboard screen. Violet node fill, left-to-right flow.” + style block.
- P4 — deployment topology (16:9): “Cloud topology: code-host box top-left pushing glowing arrows into an Oracle Cloud region box containing one VM with four stacked containers (streaming, app, edge proxy, demo load), vault/safe icon beside it, HTTPS arrow to a browser window with dashboard. Minimal labels as icons only.” + style block.
- P5 — triage card close-up (4:3): “Macro shot of a single AI incident triage glass card: rose Sev-1 badge, five-dot confidence meter, evidence rows, recommended-action checklist, incident number INC-0000001. Ultra-clean, dramatic rim light.” + style block.
Tip: generate at 2x, downscale, and overlay real screenshots (dashboard, timeline) for Figures 1–2 if photographic fidelity is preferred over illustration.